

What Can You Do Here?
- See Total Revenue: Instantly view the current value of your pipeline.
- Forecast Closures: Find out what deals are expected to close this week or month.
- Track Performance: Compare your team’s results to previous months.
- Monitor Deal Progress: Check how long deals stay in each stage and what’s being done to move them forward.
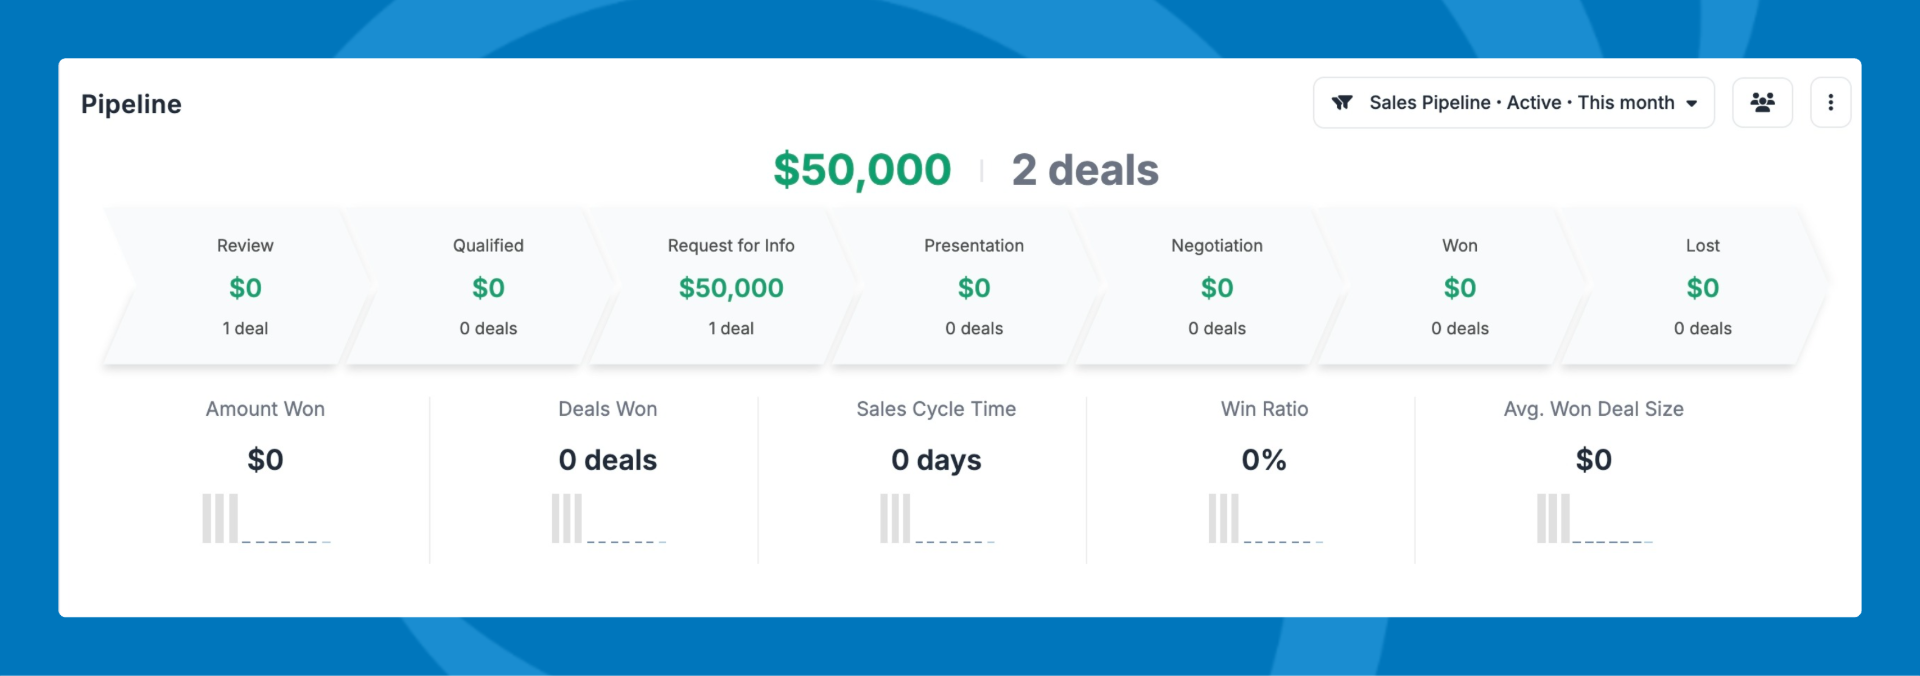
1. Pipeline Overview
- The headline shows your pipeline’s total revenue at a glance.
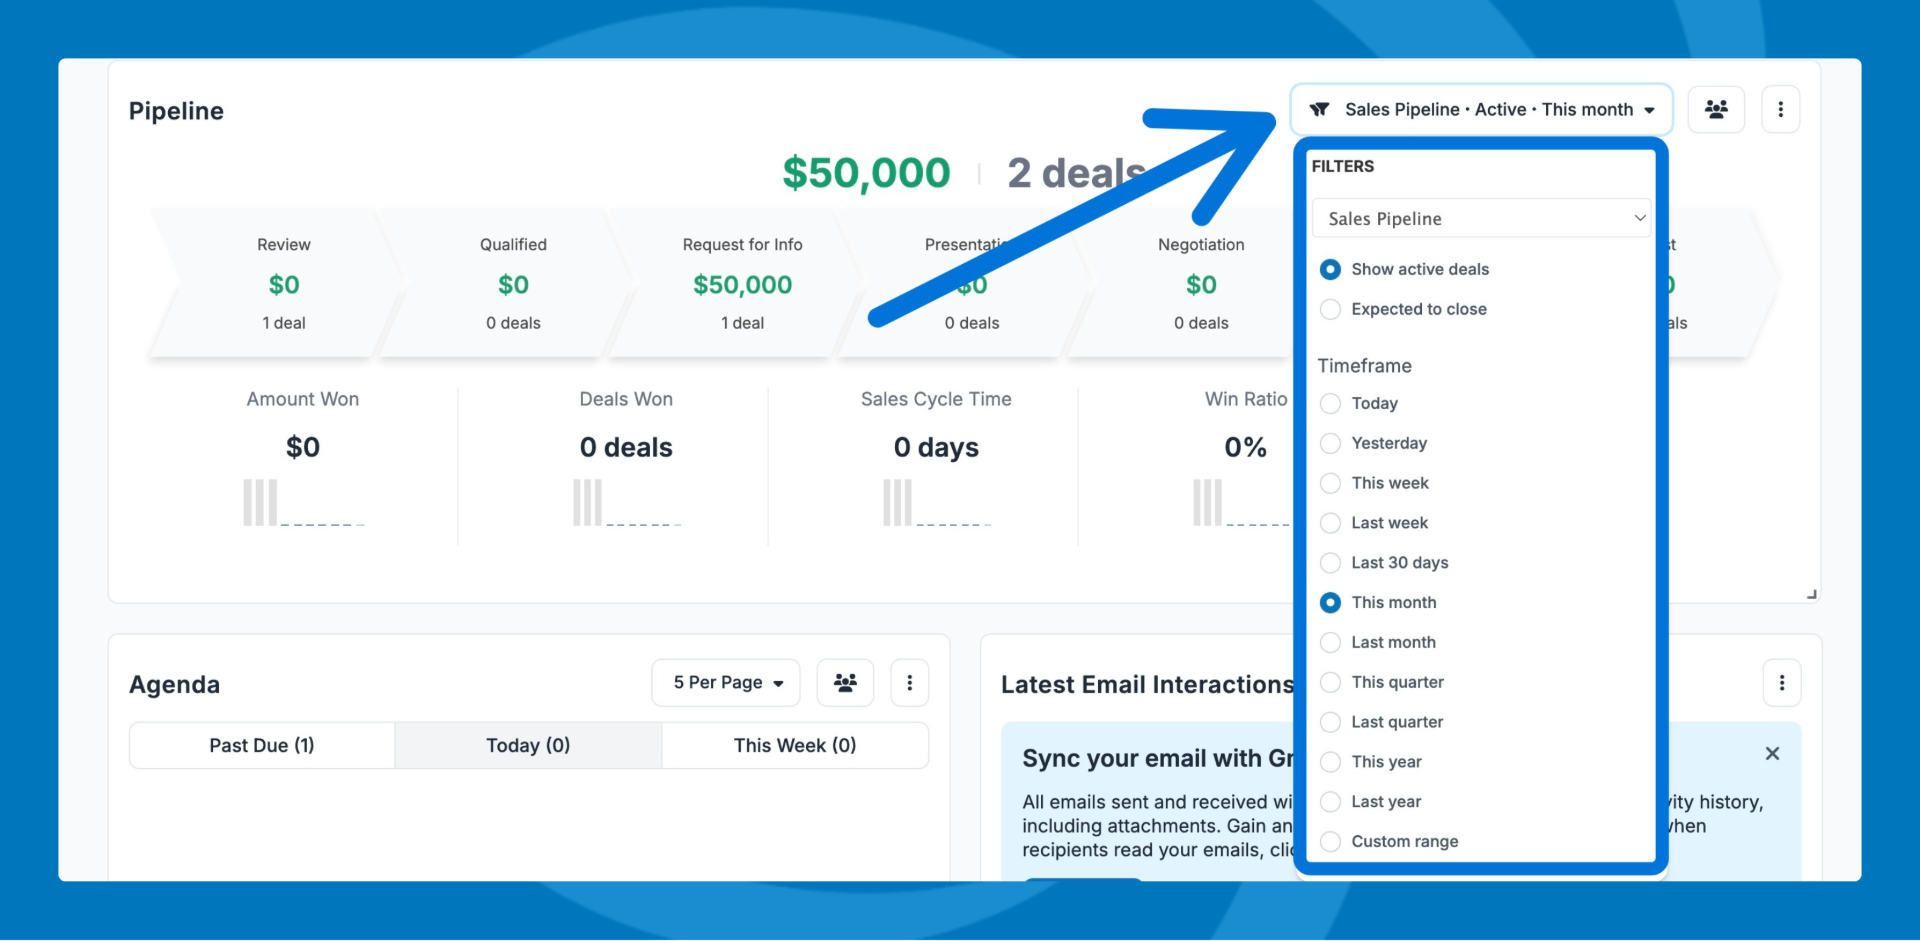
- Managers and executives can switch views to see individual team members’ pipelines using the Users option in the top-right.
- Use the Active Deals dropdown to filter for deals expected to close this month.
- Quickly assess which deals are likely to close and which may need extra attention.
- Select a stage to see all deals currently in that stage.
- Review stats below the overview to measure current performance against past months.
- Track how quickly deals are closing and whether your team is meeting revenue goals.
- Use these numbers to spot trends and adjust your strategy.
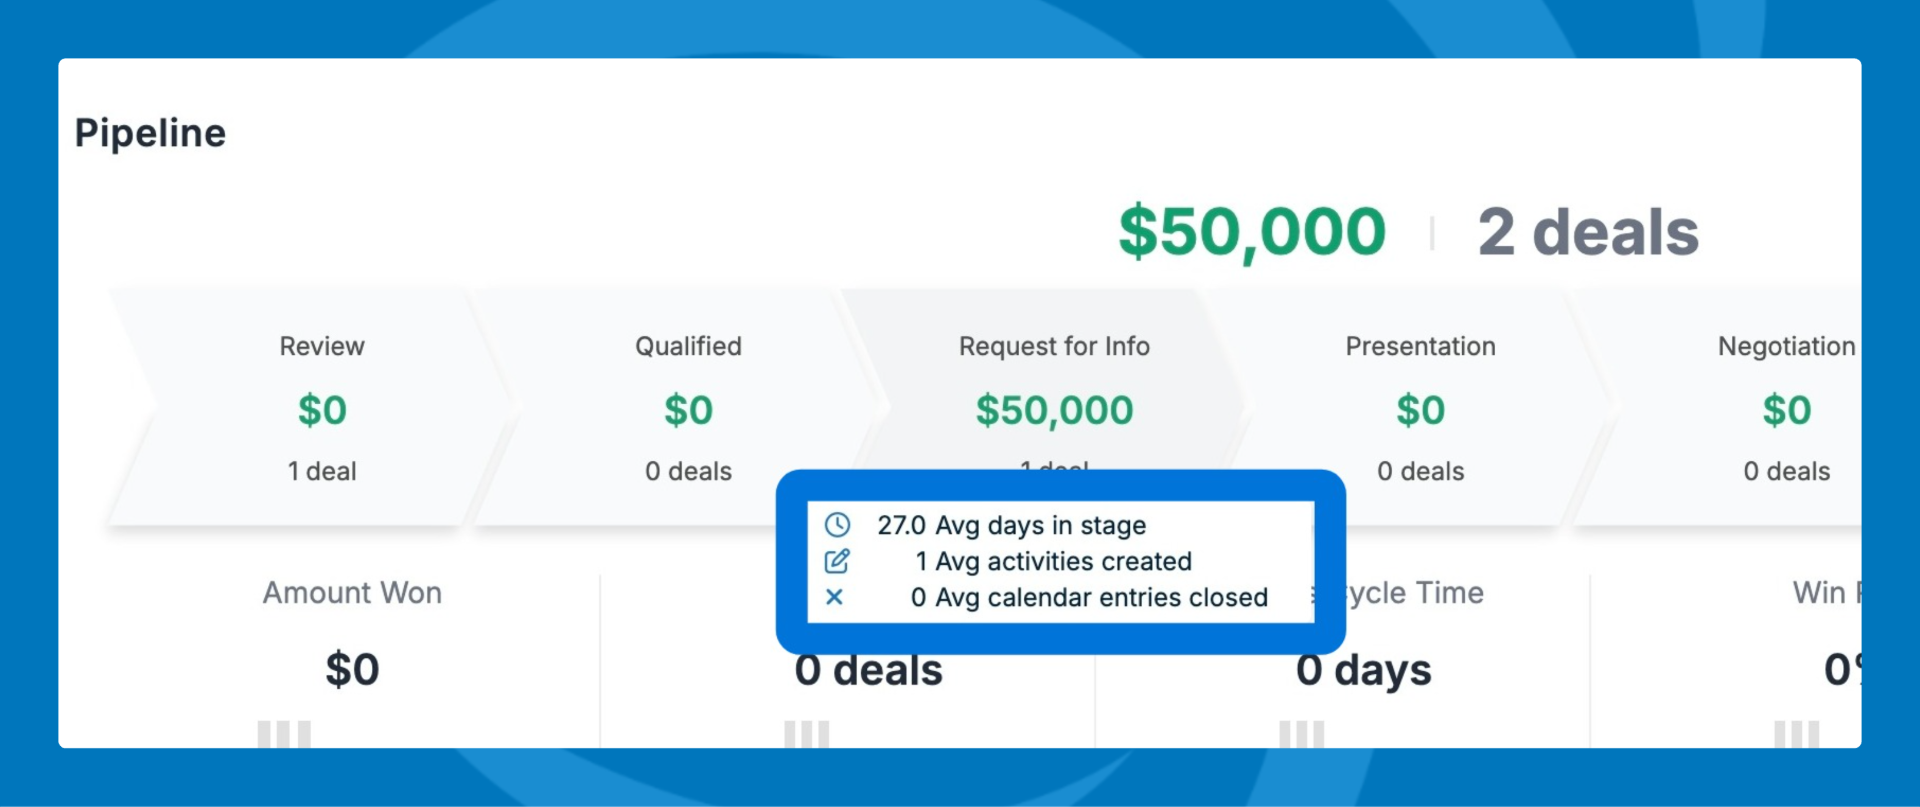
4. Deal Stage Insights
- Hover over each stage to see:
- Average days deals spend in that stage
- Average number of activities created
- Average number of calendar tasks scheduled
- These insights help you identify bottlenecks and opportunities for improvement.
If you have any questions or run into any trouble, reach out to our support team at [email protected].
Next: Universal Search