

What the Activity Scoreboard Tracks
The Activity Scoreboard includes these activity types: 
- Calendar Tasks or Events that are marked completed and linked to a Company, Deal, or Person.
- Activities by category added to a Company, Deal, or Person.
- System-generated notes created when actions happen on Deals, Companies, and People.
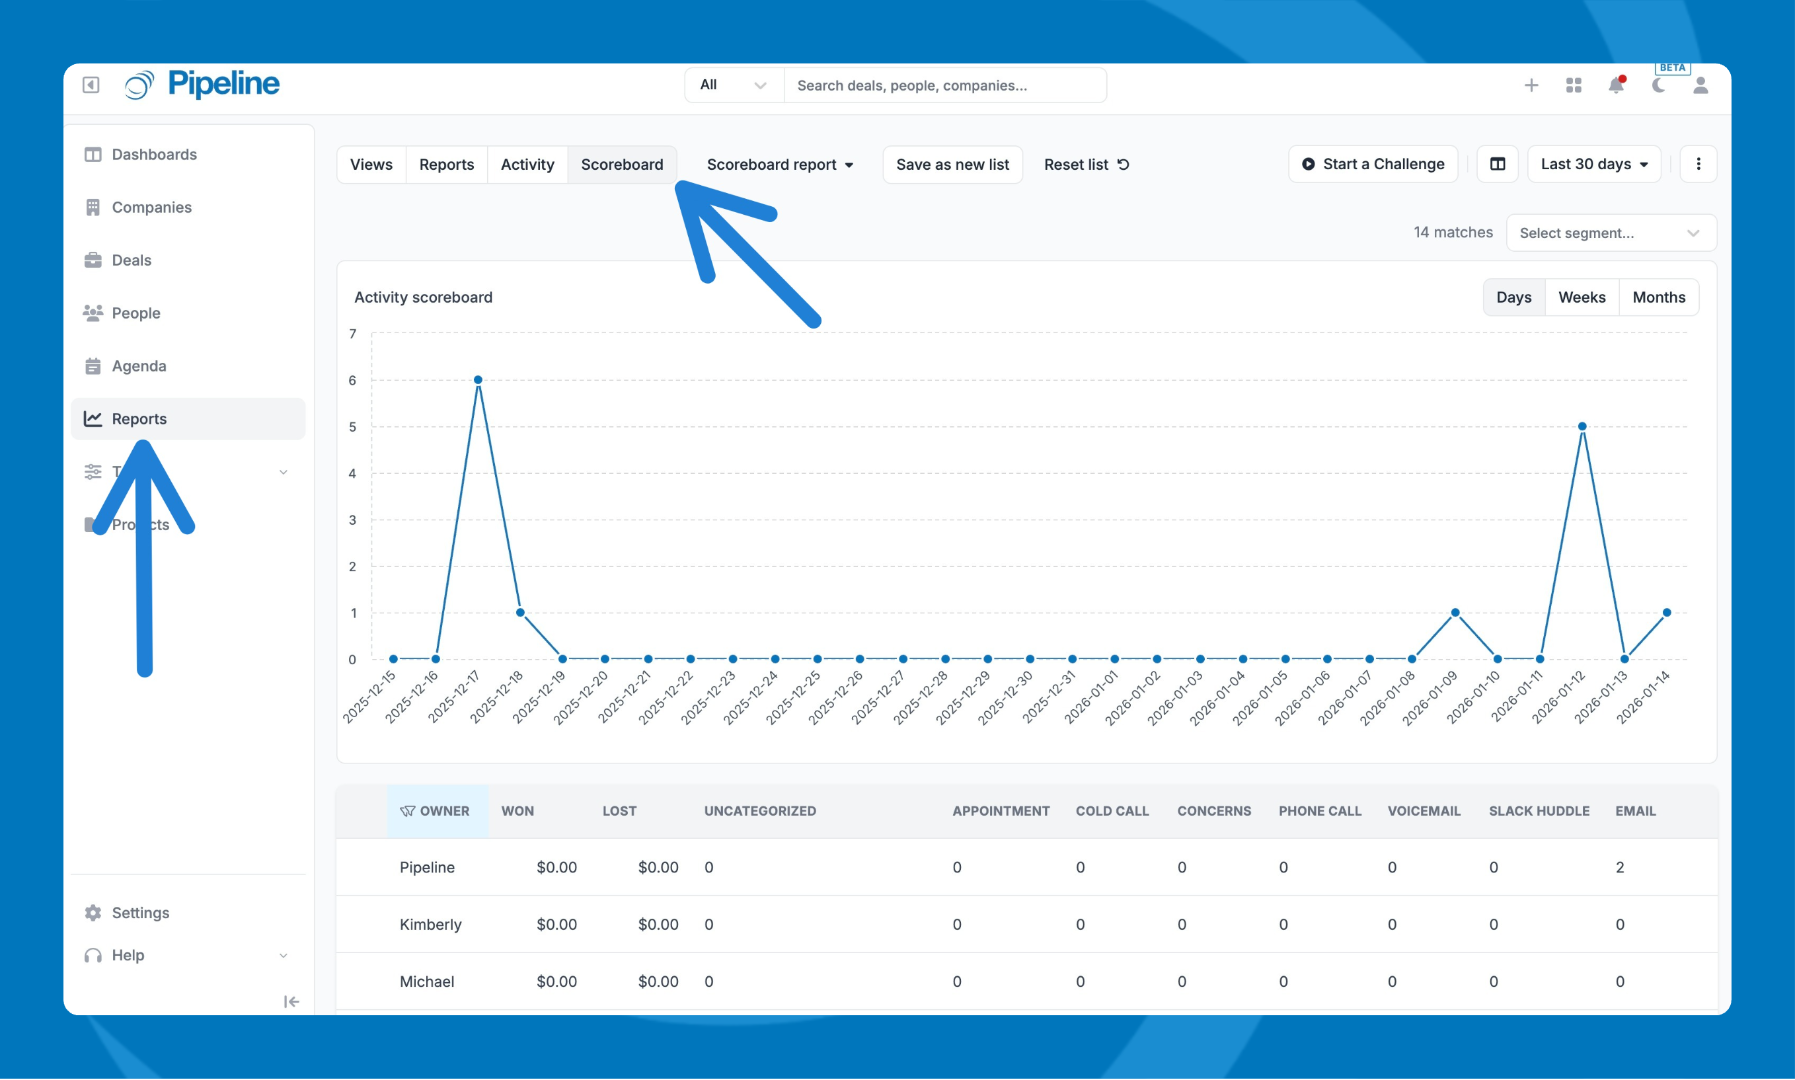
- Go to Reports.
- Select Activity Scoreboard.
Customize What You See
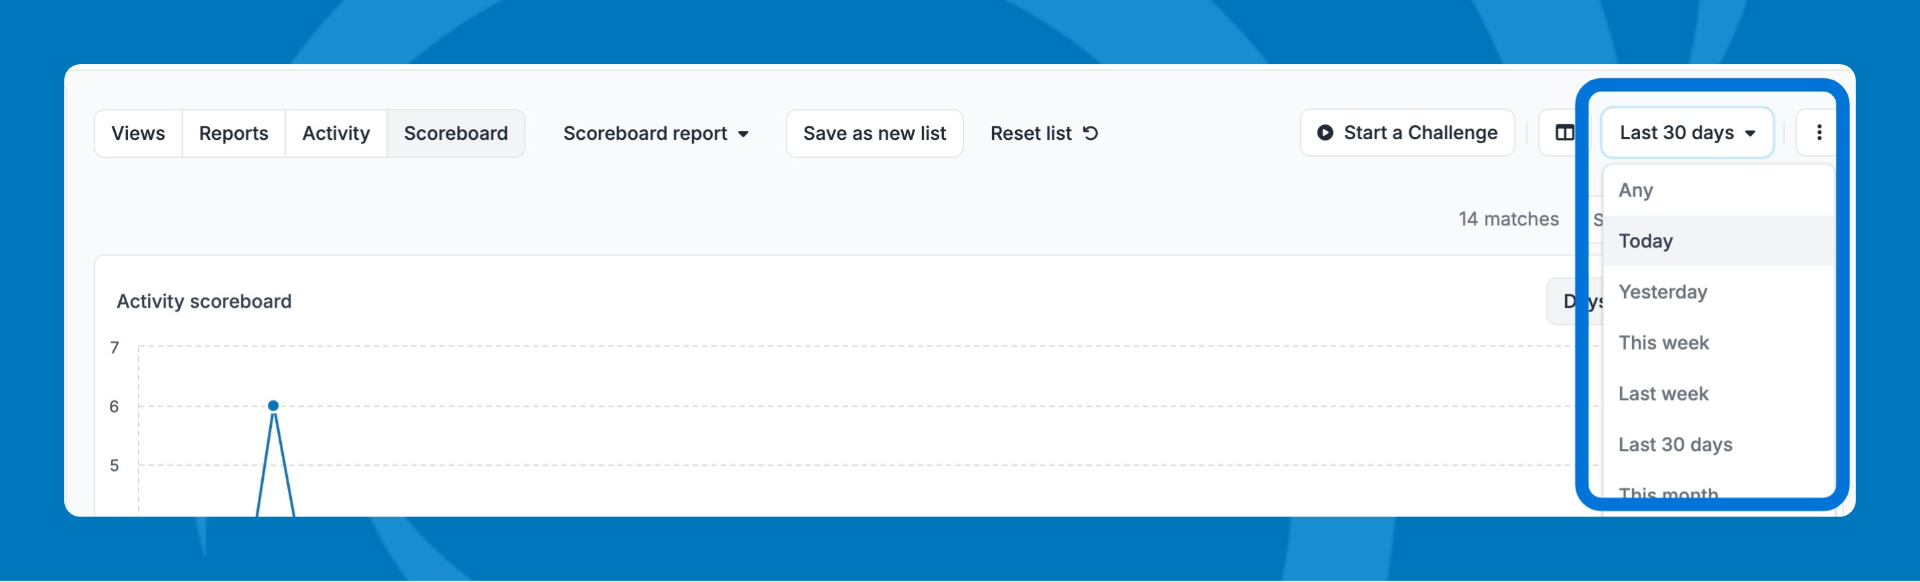
Change the date range
Use the date range selector to review a specific time period or compare activity trends over time.
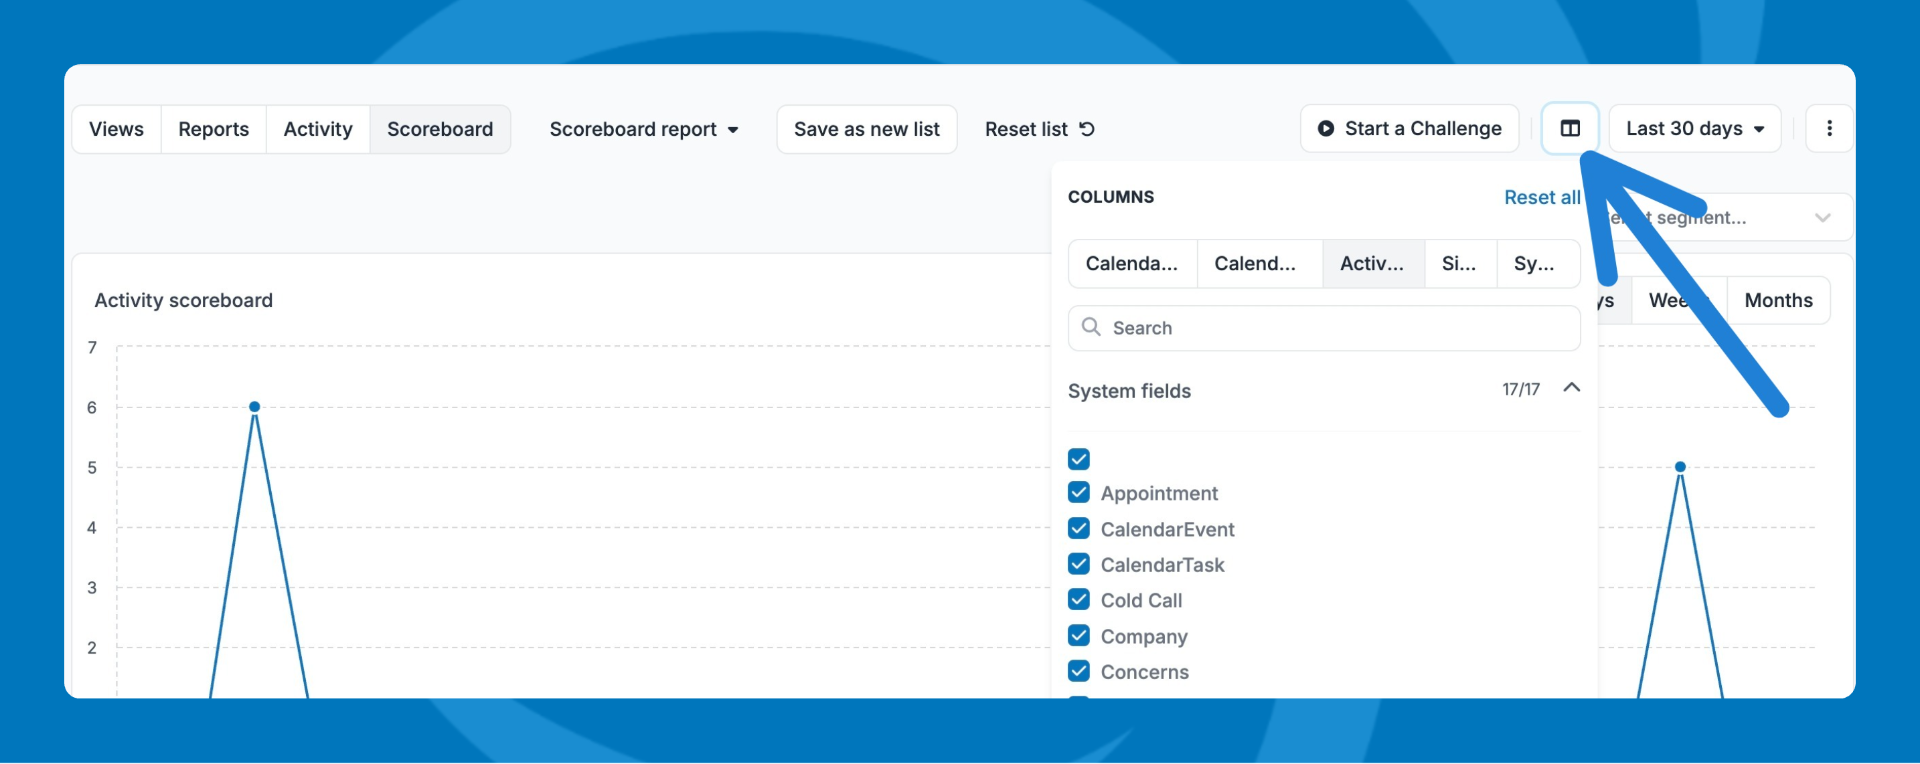
Add or remove columns
- Click the columns icon.
- Select the columns you want to show in the table.

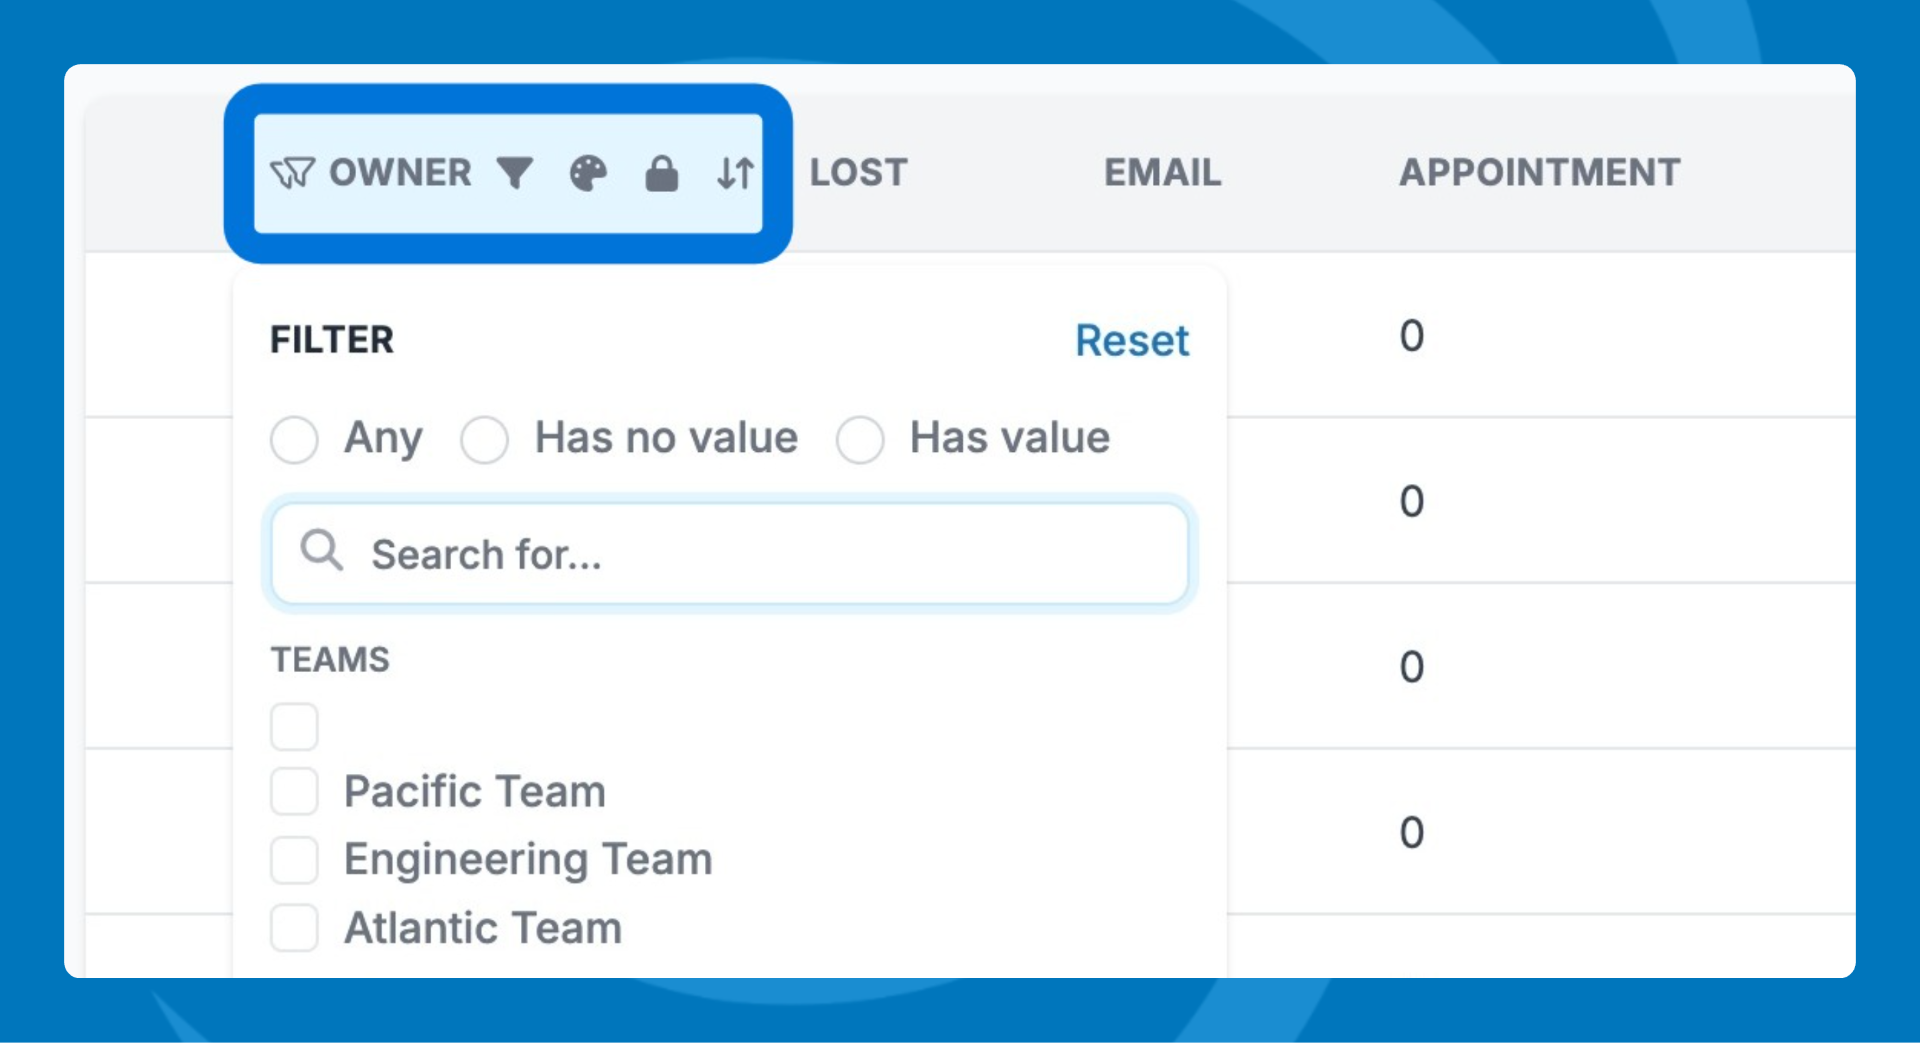
Sort or Filter Results
Click any column header to sort—helpful for spotting who’s logging the most or least activities.
The Owner column is the only column that can be filtered if you wish to review specific teams or users.
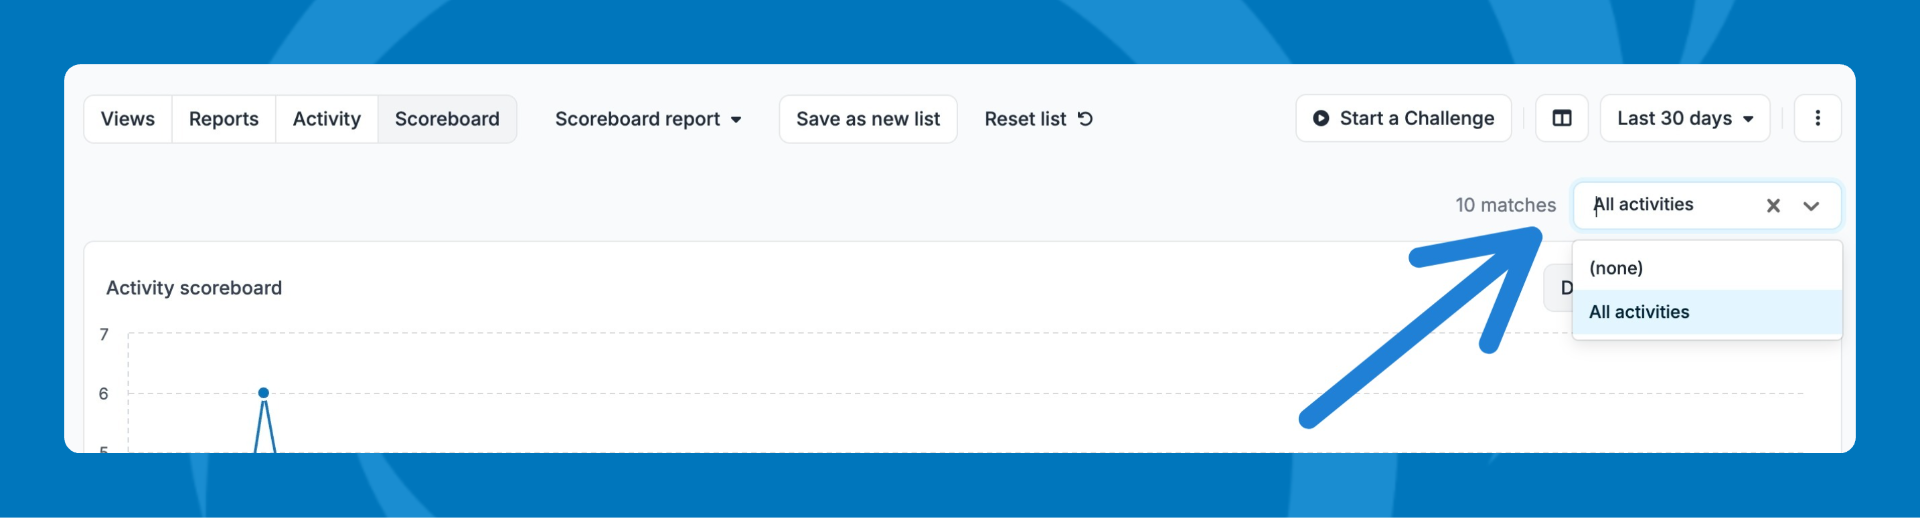
If you have a saved Activity Report list, you can select it as a segment. This will apply the filters from that list to the Scoreboard.
View Totals at a Glance
Activity totals appear at the bottom of the table, so you can quickly see team output for the selected date range.
 
Additional Options
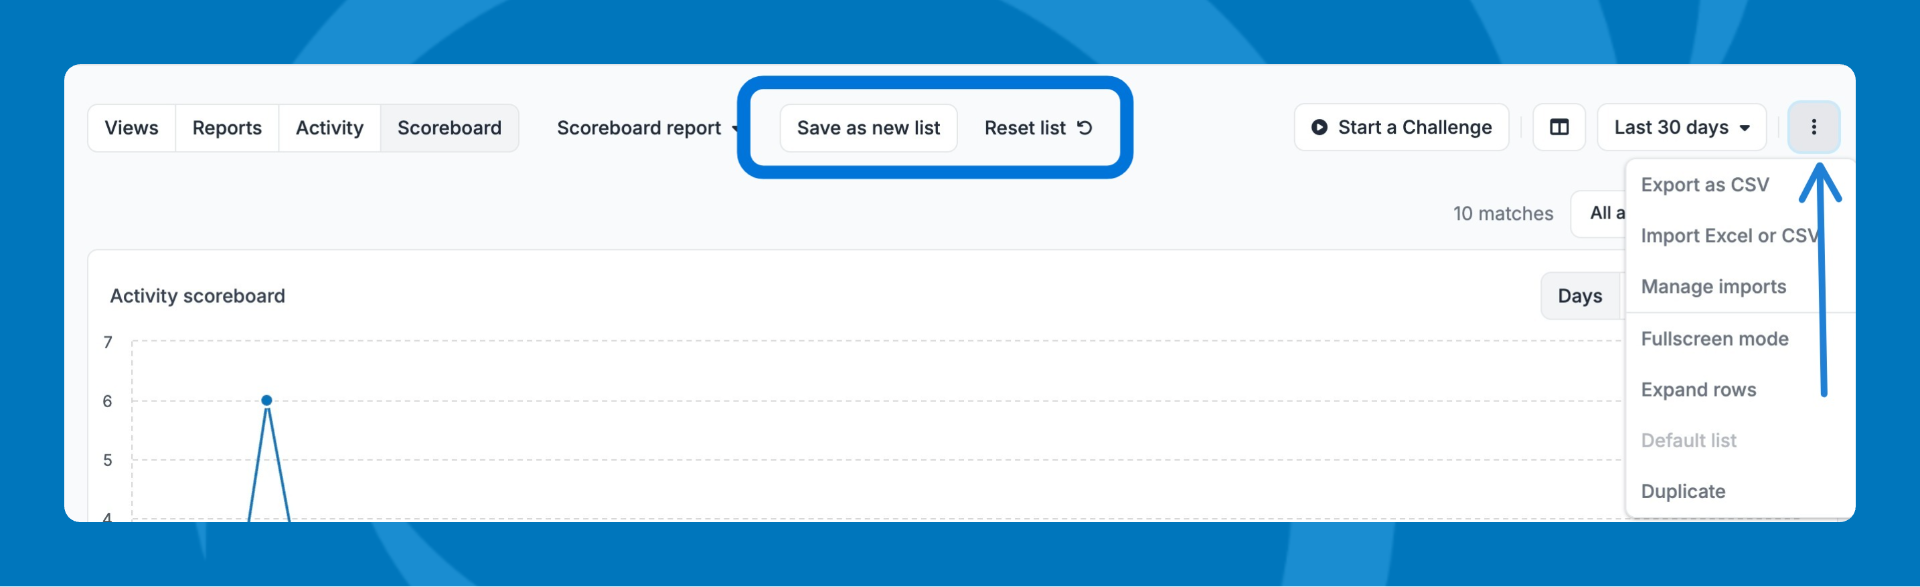
- Save your customized scoreboard so that you can go back to it later.
- By clicking the three dots in the top right corner, you have options to:
- Export
- Duplicate
Need help? Contact support at [email protected].