
Views vs. Reports
- A report is a single chart or metric (for example, deals won over time).
- A View is a collection of reports displayed together so you can compare results side-by-side.
A Report View is a saved page that contains multiple reports you want to review together. It’s ideal when you’re tracking performance across owners, stages, sources, or time periods without hopping between individual reports
Create and Manage a View
- Go to Reports.
- Open the Views dropdown, then select Create new view.
- Click Add report to place reports on the View.
- You can also manage existing reports in the view by going to their specific settings, refresh or remove.
- Use the View menu to Rename, Duplicate, or Delete the View (and download when needed).

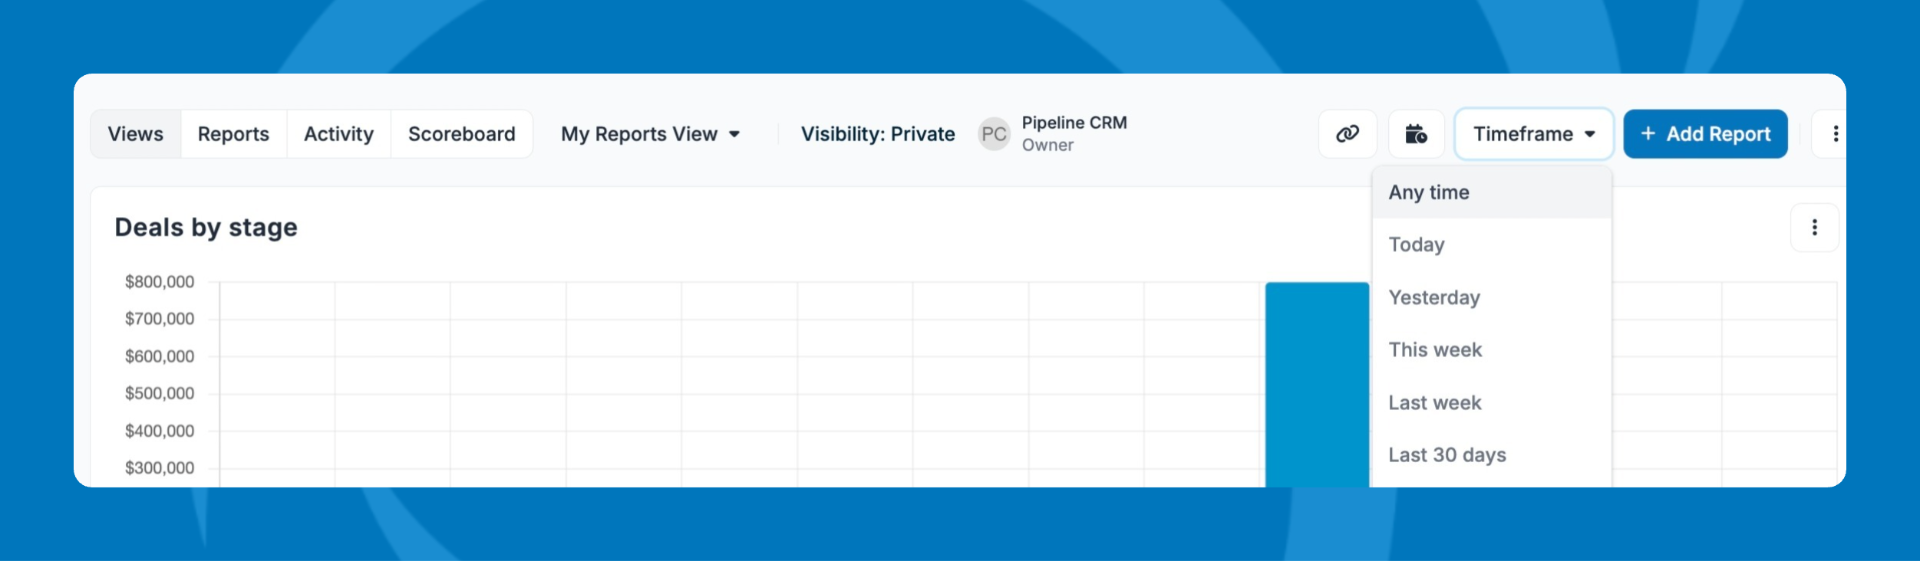
Update the Timeframe for the whole View
- Select a Timeframe to apply one date range across all reports in the View—even if those reports use different date fields (like Added vs Closed).
- Heads up: reports without date-based data won’t change when you update the Timeframe. 
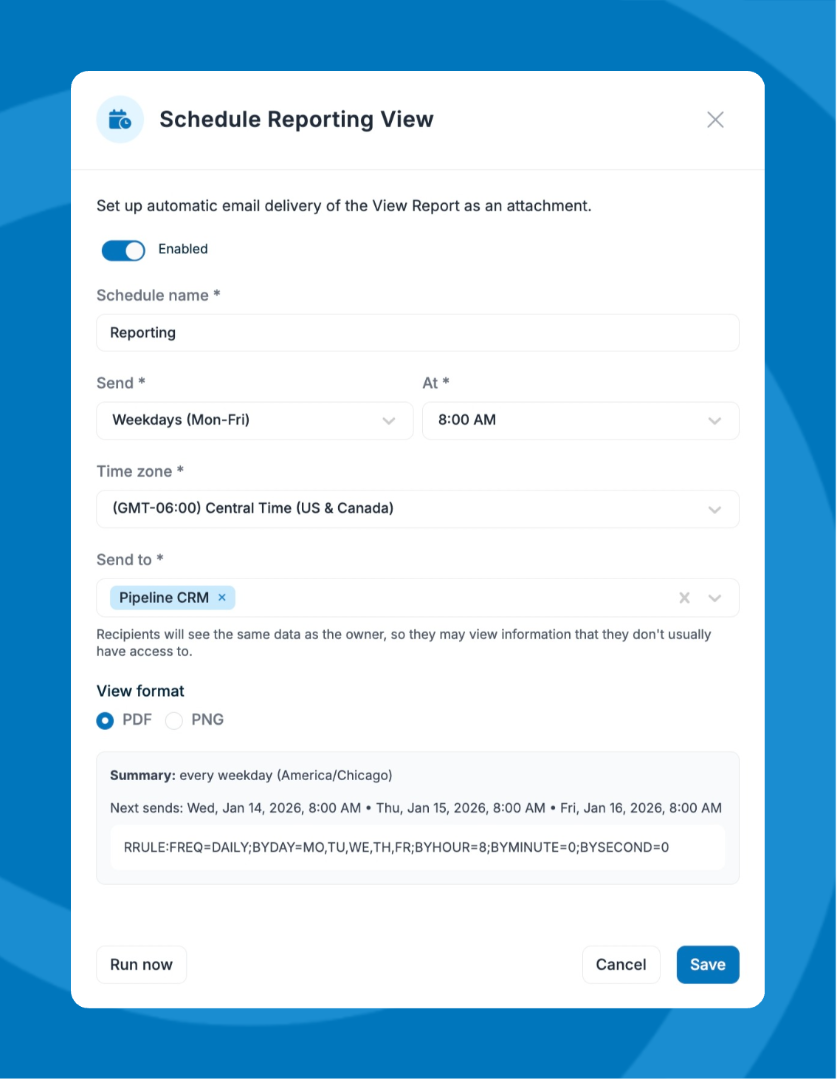
Schedule a View (Grow Plan only)
Scheduling emails a snapshot of your View on a recurring schedule. 
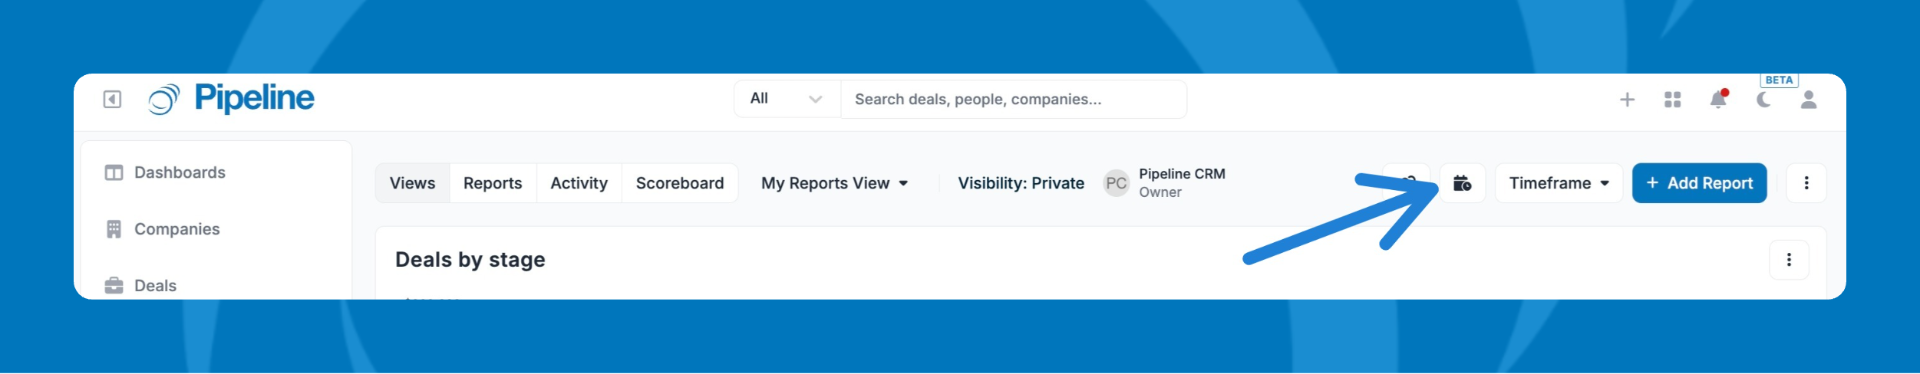
- Open the View you want to send.
- Click the Schedule icon.
- Choose:
- Send every: Weekdays, Daily, Monthly, or Quarterly
- Time
- Recipients: must be Pipeline users (with active Pipeline CRM accounts)
- Attachment type: PDF or PNG
- Click Enable. 
Creating and Customizing Reports
Pipeline includes several pre-built reports you can use as-is or customize, including:
- Deals Won
- Win Ratio
- Won Deals by Source
- Lost Deals by Loss Reason
- Deals by Stage
- Deals by Owners
- New Companies
- New People
You can build a report from scratch or modify a default report and save it as your own.
- Go to Reports.
- Click Create new report (top-right).
- To reuse an existing report, open it, make updates, then Save as a new report.
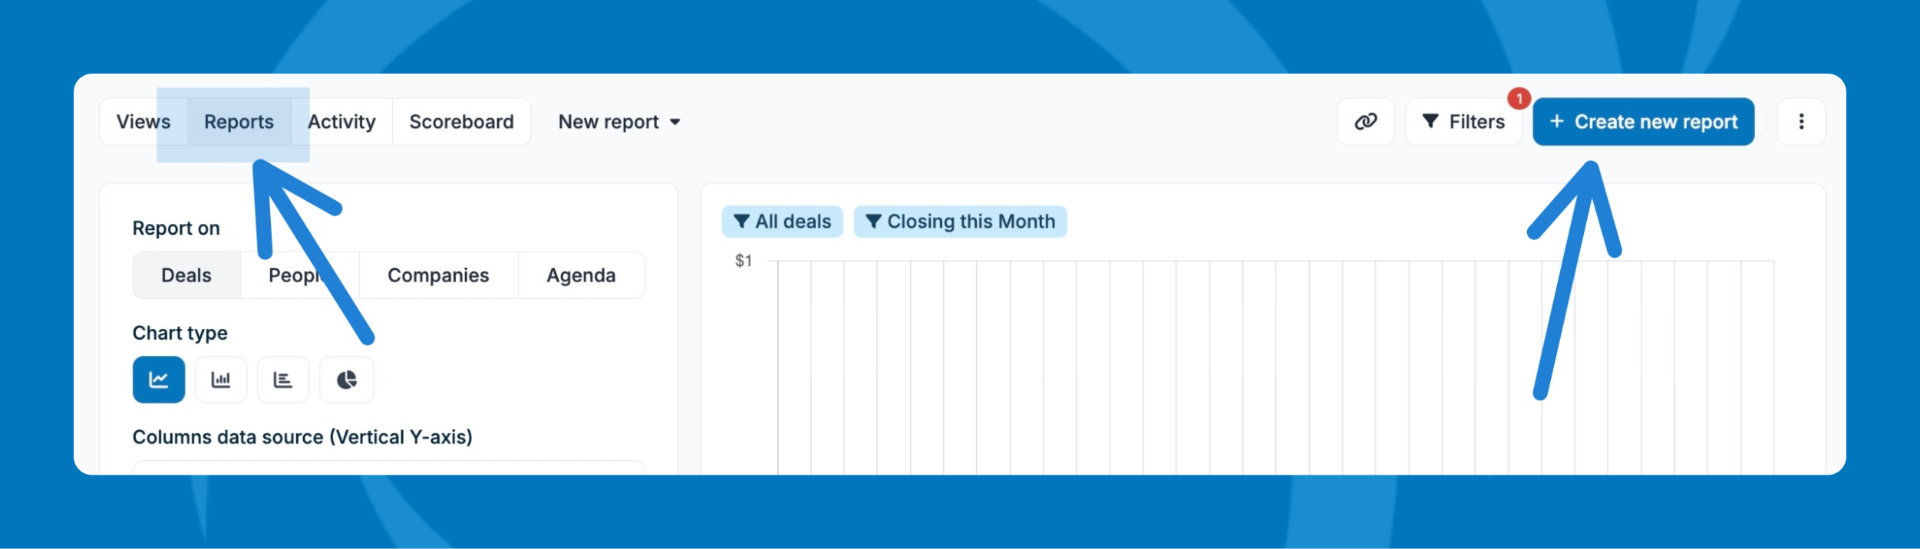
Report Builder Settings
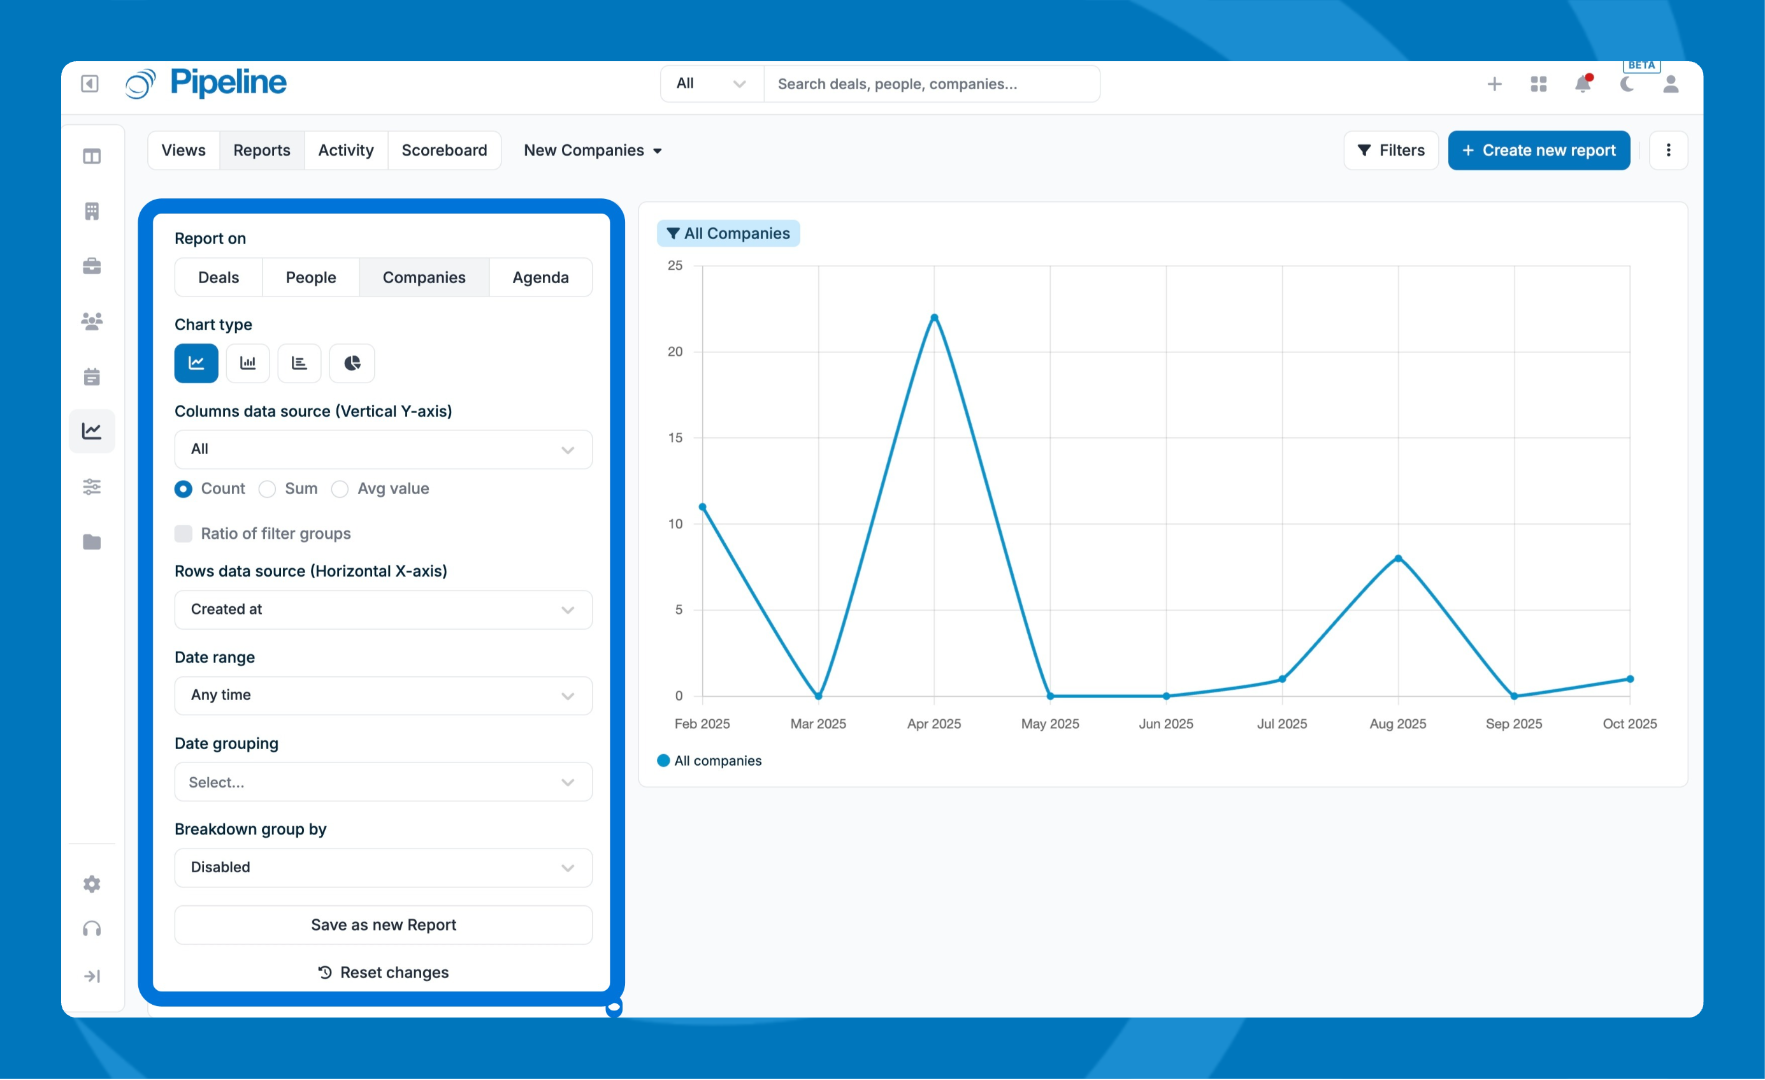
Report on
Choose the data source:
- Deals
- Companies
- People
Choose how the data displays:
- Line
- Bar (Bar charts can be stacked)
- Horizontal Bar
- Pie
This is what you are measuring. Options vary by report type:
- Deals: deal amount, deal count, and eligible numeric/currency/calculated custom fields
- Companies: company count and eligible numeric/currency/calculated custom fields
- People: people count and eligible numeric/currency custom fields
- Sum, Count, Average, and Ratio of segments (value or count)
This is how your data is grouped, like:
- Added, Updated, Closed, Expected to close
- Owner, Source, Status, Stage, Pipeline, Loss Reason, Revenue type
- Certain custom field types (Picklist, Checkbox, Boolean, Multiple association, Single association)
Breakdown group by: Adds a second layer of grouping for deeper comparisons.
Forecast: Projects results based on past data.
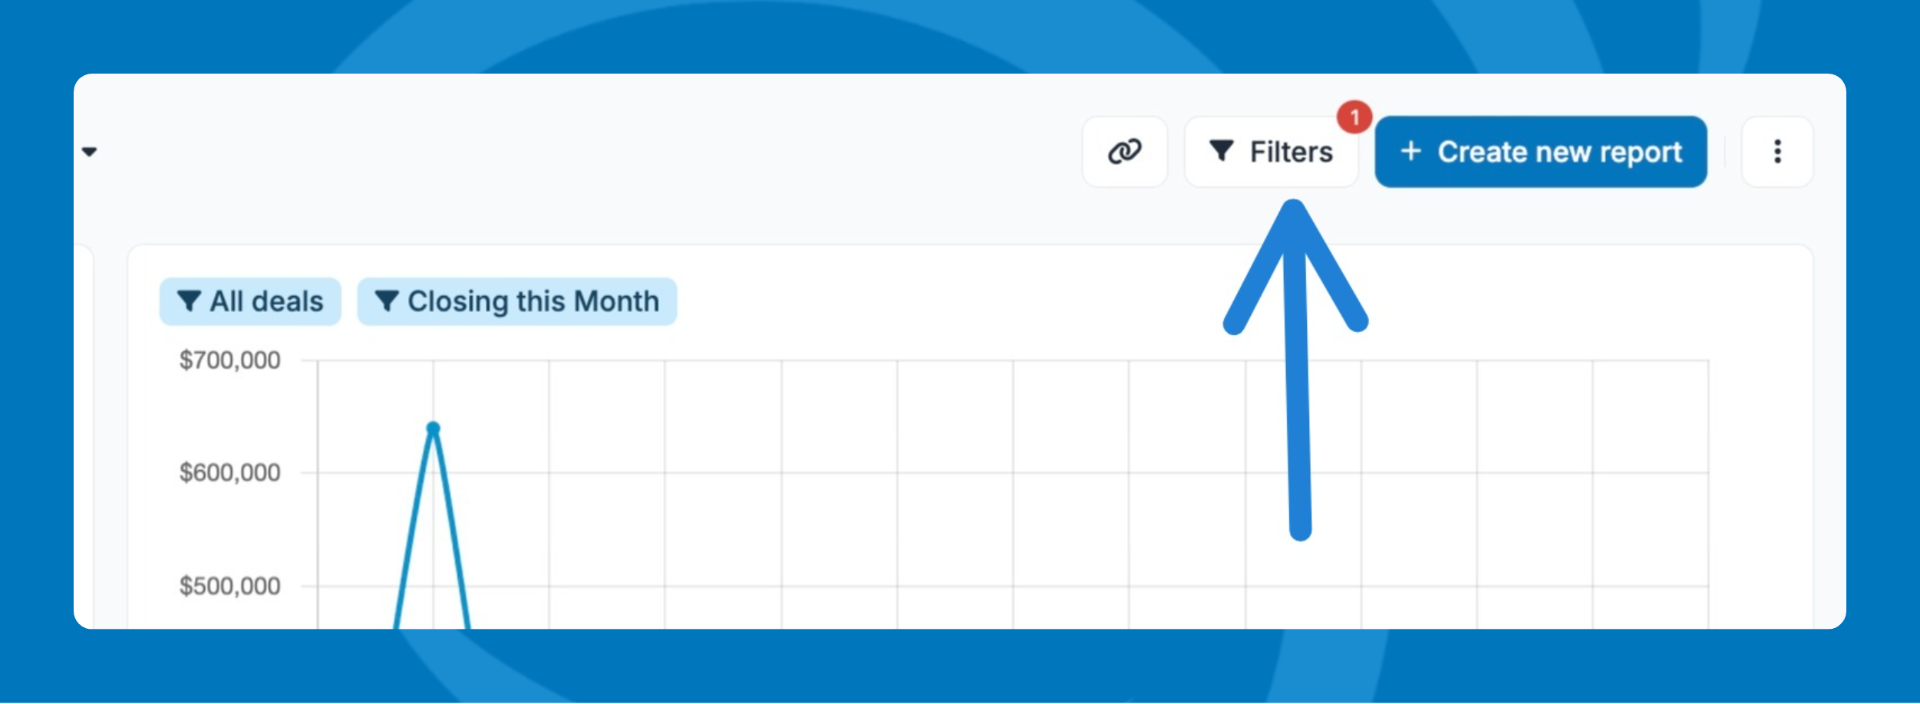
Filters
Filters narrow what data appears in the report.
- Open any report.
- Click Filters (near Share and Create Report).
- Click Select, add the fields you want, name the filter, then click Apply.
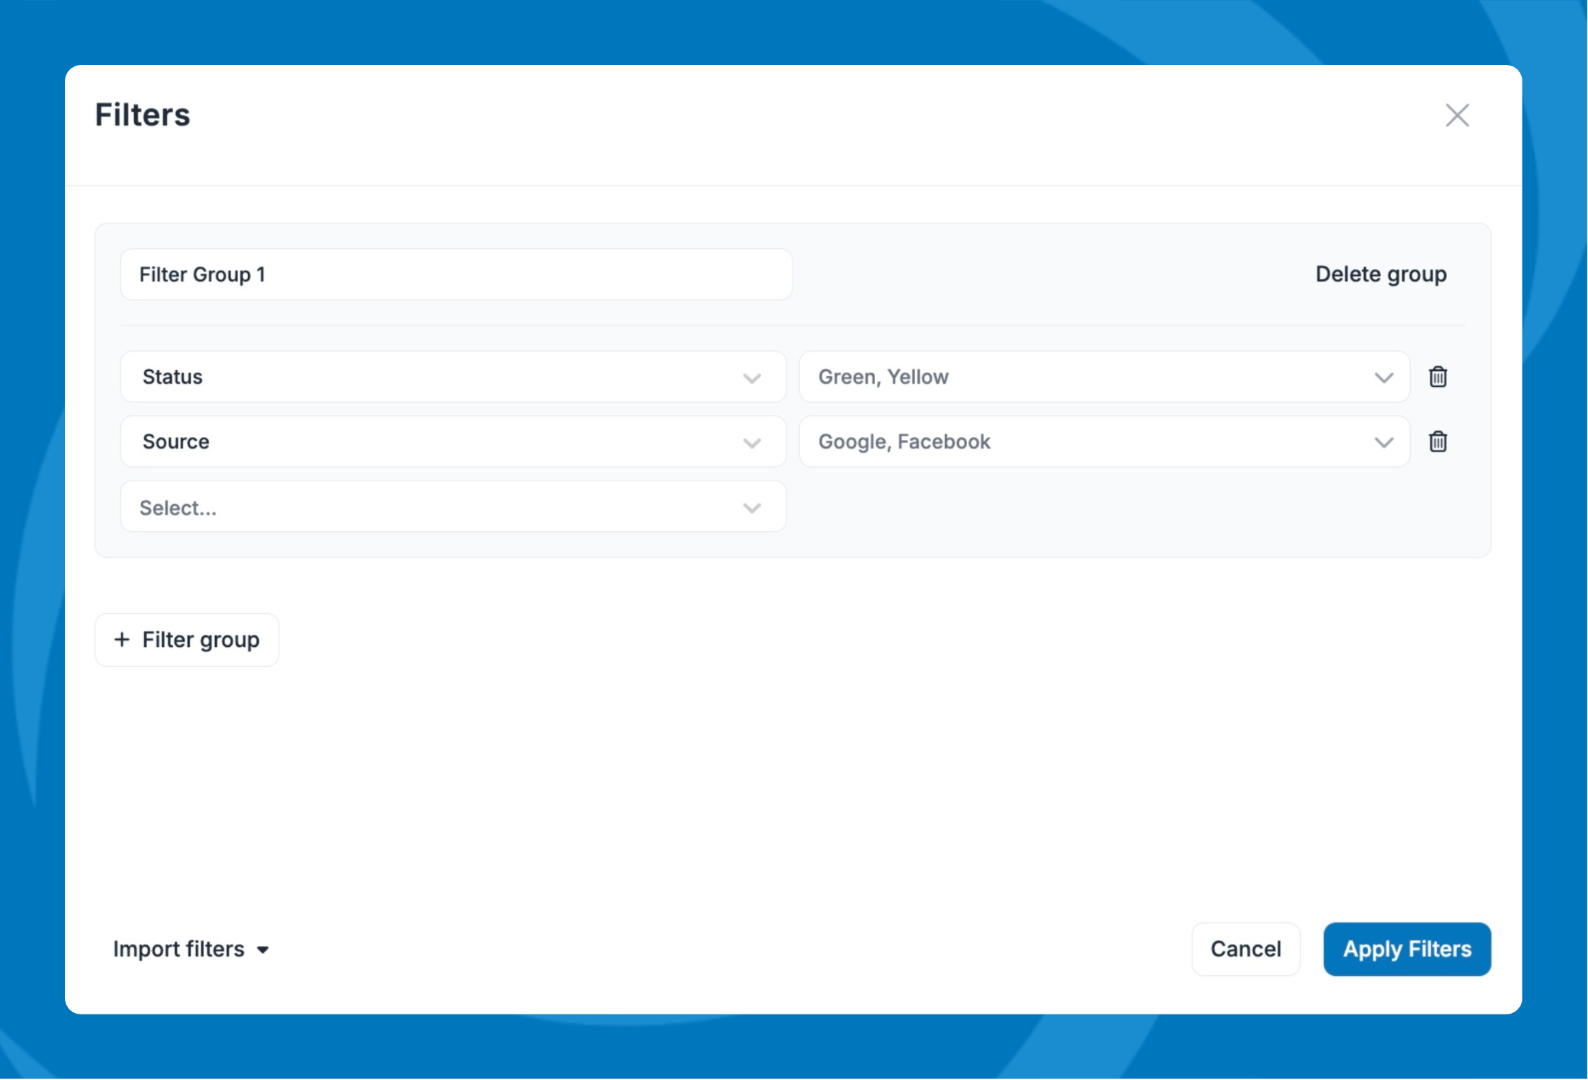
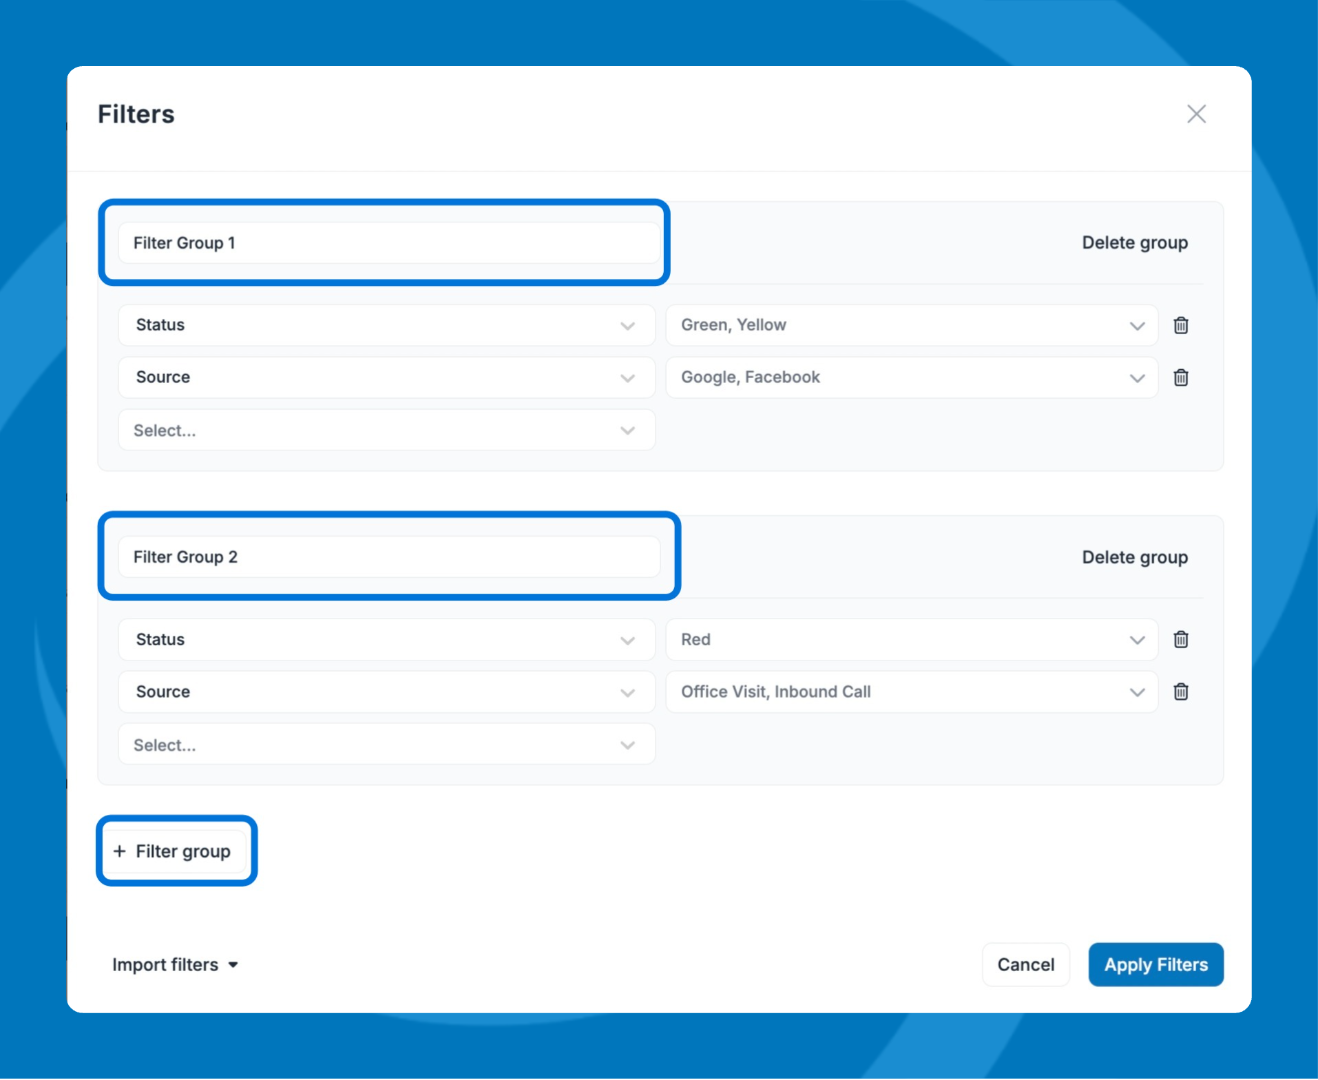
Filter Groups
Filter groups are groups of filters that let you compare different cohorts. You can also import filters from a List View.
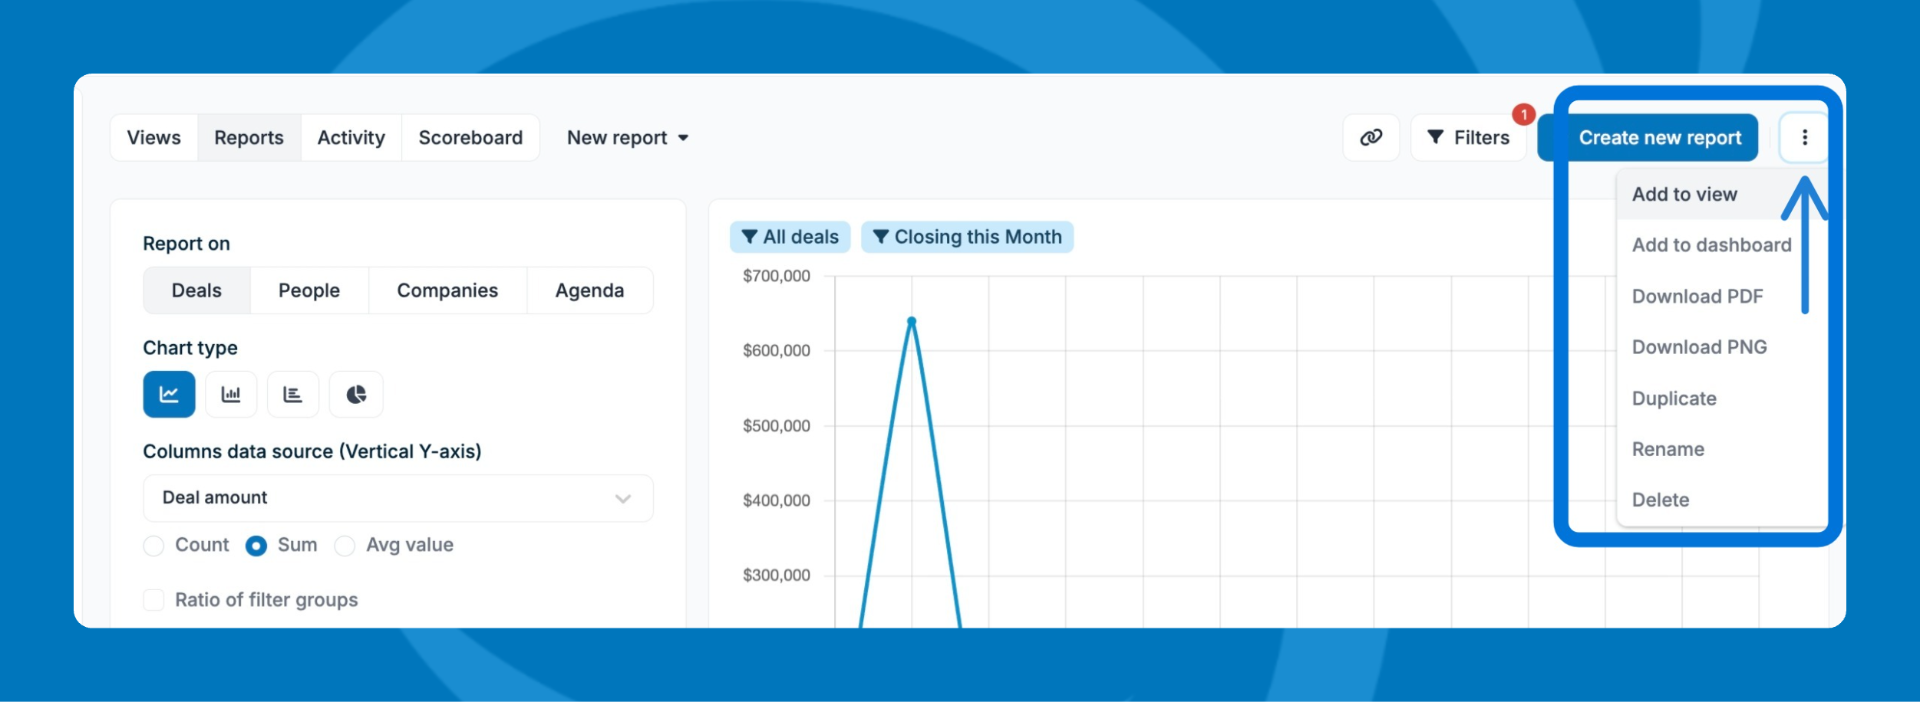
Managing reports
From the report options, you can:
- Add to a reports view
- Add to dashboard
- Download as PDF or PNG
- Duplicate
- Rename
- Delete
Need help? Contact support at [email protected].